We may earn a commission when you buy through our links. Learn more
Pick your town and set the panels as they would sit at home. The calculator gives the electricity a kit makes in a typical year, month by month, after the 800 W output cap, then the same figure for every plug-in kit we priced.
How it works
- Sunshine data: PVGIS (European Commission Joint Research Centre), API v5.3, radiation database PVGIS-SARAH3 and ERA5 weather, monthly averages 2005 to 2023, horizon from terrain data, read on 14 November 2026 for 33 town centres.
- Kit: crystalline silicon panels, 14% system losses (cables, inverter, dirt), output scaled to the panel watts you enter. Bifacial gains are not counted.
- 800 W cap: hourly PVGIS series 2021 to 2023, each hour capped at 800 W, for 800, 1,000, 1,200, 1,600, 2,000 and 2,400 Wp; values in between are interpolated. Below 800 Wp nothing is lost.
- Not counted: shade from neighbours, trees or the balcony itself, glass balustrades in front of the panels, snow, panel ageing. Each can cut output more than the choice of kit.
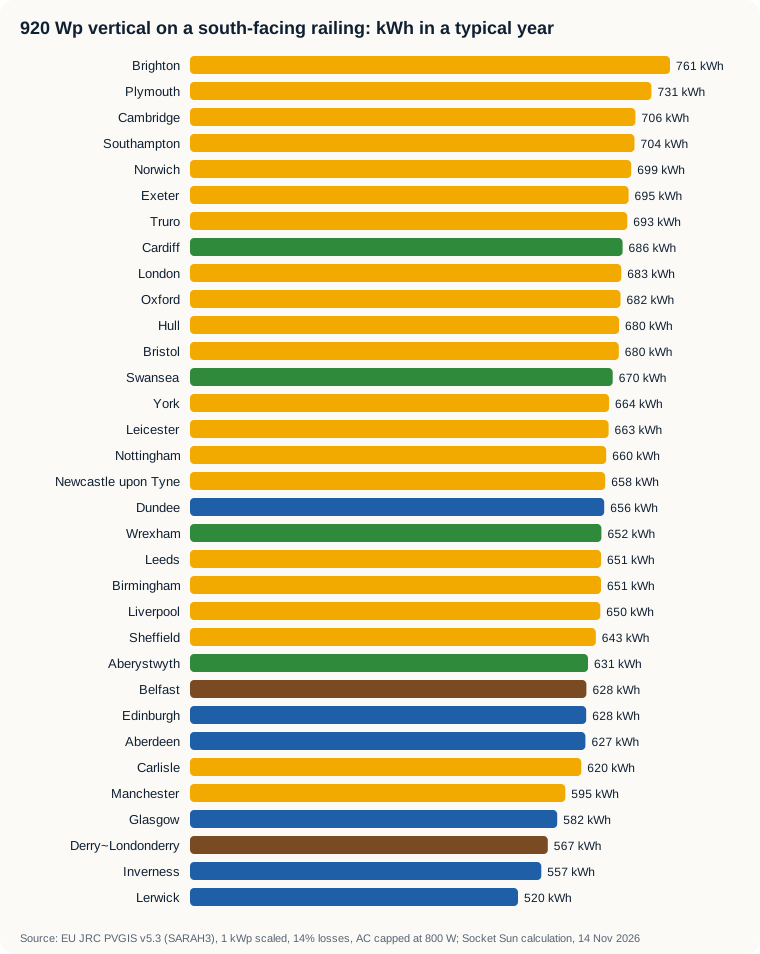
All 33 towns, 920 Wp
| Town | Nation | South, vertical | South, 35° | South, 10° | East, vertical | North, vertical |
|---|---|---|---|---|---|---|
| Birmingham | England | 651 | 888 | 804 | 455 | 185 |
| Brighton | England | 761 | 1,062 | 958 | 505 | 183 |
| Bristol | England | 680 | 940 | 854 | 470 | 187 |
| Cambridge | England | 706 | 957 | 859 | 488 | 188 |
| Carlisle | England | 620 | 839 | 758 | 426 | 179 |
| Exeter | England | 695 | 967 | 880 | 489 | 192 |
| Hull | England | 680 | 910 | 812 | 461 | 178 |
| Leeds | England | 651 | 875 | 786 | 445 | 181 |
| Leicester | England | 663 | 902 | 814 | 462 | 186 |
| Liverpool | England | 650 | 887 | 801 | 433 | 177 |
| London | England | 683 | 937 | 847 | 480 | 186 |
| Manchester | England | 595 | 815 | 742 | 422 | 178 |
| Newcastle upon Tyne | England | 658 | 871 | 776 | 438 | 176 |
| Norwich | England | 699 | 948 | 852 | 483 | 186 |
| Nottingham | England | 660 | 892 | 803 | 456 | 184 |
| Oxford | England | 682 | 936 | 847 | 477 | 190 |
| Plymouth | England | 731 | 1,031 | 938 | 505 | 188 |
| Sheffield | England | 643 | 871 | 785 | 441 | 181 |
| Southampton | England | 704 | 978 | 887 | 493 | 189 |
| Truro | England | 693 | 979 | 898 | 487 | 196 |
| York | England | 664 | 891 | 799 | 454 | 181 |
| Aberystwyth | Wales | 631 | 877 | 800 | 430 | 177 |
| Cardiff | Wales | 686 | 958 | 870 | 462 | 181 |
| Swansea | Wales | 670 | 932 | 847 | 464 | 180 |
| Wrexham | Wales | 652 | 889 | 806 | 452 | 186 |
| Aberdeen | Scotland | 627 | 821 | 728 | 401 | 166 |
| Dundee | Scotland | 656 | 862 | 764 | 428 | 171 |
| Edinburgh | Scotland | 628 | 830 | 741 | 419 | 172 |
| Glasgow | Scotland | 582 | 784 | 710 | 395 | 173 |
| Inverness | Scotland | 557 | 745 | 675 | 378 | 169 |
| Lerwick | Scotland | 520 | 701 | 635 | 345 | 156 |
| Belfast | Northern Ireland | 628 | 845 | 762 | 431 | 180 |
| Derry~Londonderry | Northern Ireland | 567 | 774 | 708 | 403 | 179 |
How we compare: criteria, sources and dates
kWh in a typical year, after the 800 W cap [calc]. West-facing values are within a few per cent of east-facing ones; the calculator has both.
Next: what those kWh are worth, the kits on sale, and the special cases of north-facing balconies and Scotland.
Frequently asked questions
Where do the figures come from?
From PVGIS, the European Commission Joint Research Centre's free solar calculator (API version 5.3, SARAH3 satellite radiation, ERA5 weather), for 1 kWp of crystalline panels with 14% system losses, scaled to your kit. Monthly values are averages of 2005 to 2023.
How is the 800 W cap applied?
We ran PVGIS hourly series for 2021 to 2023 for every town and setting, capped each hour at 800 W for kits of 800 to 2,400 Wp, and applied the share kept, month by month, to the long-term averages. Hourly averages smooth out short peaks, so the real loss can be a little higher.
How much does a plug-in solar kit make in Manchester?
About 595 kWh a year for 920 Wp vertical on a south-facing railing, and 815 kWh tilted at 35° [calc].